
01
Identify
We define the metrics, audiences and decisions the dashboard must support.
Modern software, mobile products and data systems
built in the Netherlands.
KPI dashboards, reporting and business intelligence interfaces
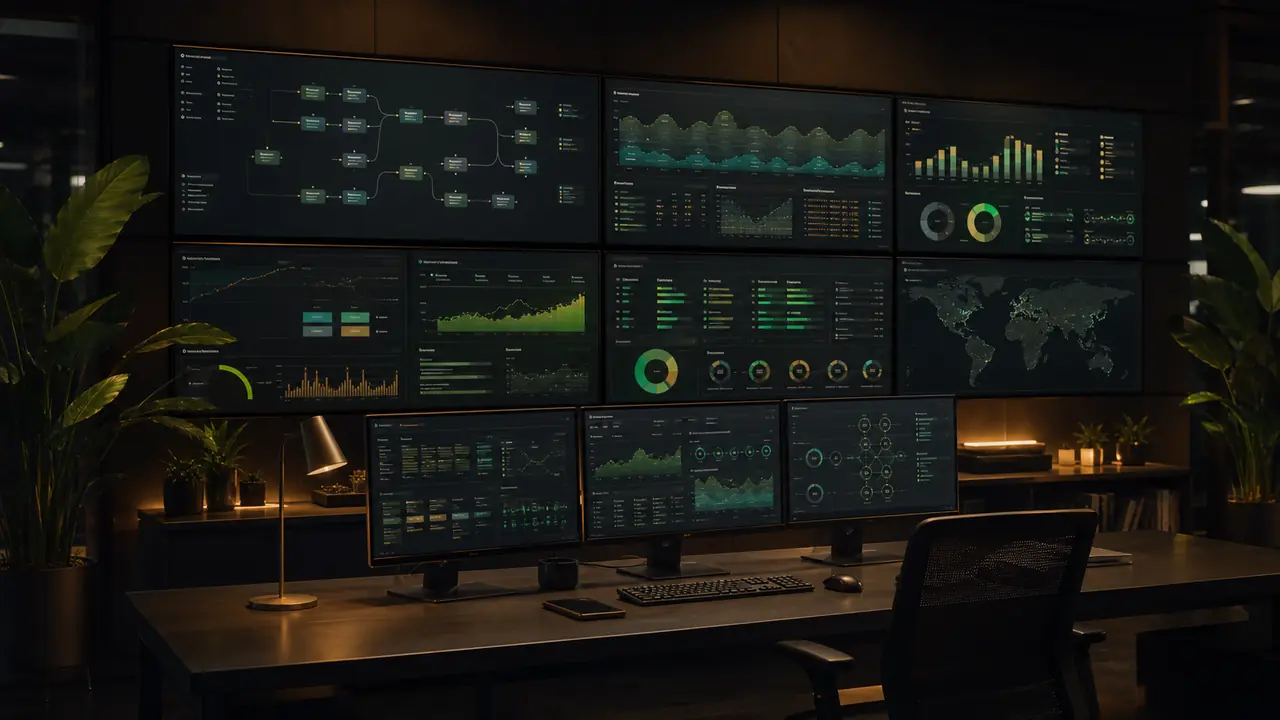
A useful dashboard is not a wall of charts. It shows the few signals that help teams make better decisions faster.
Start a ProjectWhat this solves
What we build
01
We define the metrics, audiences and decisions the dashboard must support.

02
We structure data sources, metric definitions and visual hierarchy.

03
We design dashboard views, charts, states, filters and responsive behavior.

04
We connect updates, reduce repeated reporting and refine the dashboard after use.
Process
0101 / 04
We define the metrics, audiences and decisions the dashboard must support.
0202 / 04
We structure data sources, metric definitions and visual hierarchy.
0303 / 04
We design dashboard views, charts, states, filters and responsive behavior.
0404 / 04
We connect updates, reduce repeated reporting and refine the dashboard after use.
Yes. We can plan integrations with APIs, exports or database sources depending on what the tools allow.
We do both. The design phase is important because dashboard value depends on hierarchy and clarity.
Yes. Dashboards can connect to admin panels, task flows or operational actions when the business process needs it.